Receipt Scanner Mobile App
A mobile app that lets users quickly store receipts with a photo and tracks spending for better budgeting.

Technology Stack
Key Features
- Organize receipts into groups for easy tracking and management
- Upload existing images or take photos with built-in camera
- Machine learning-powered receipt processing with YOLOv8, RCNN, and BART models
- Alternative GPT-4o pipeline for receipt inference
- Deployed on Google Kubernetes Engine for scalable processing
- Local storage with SQLite for offline access
Project Details
Receipt Scanner Mobile App
Why
I wanted a faster way to capture receipts and track spending while learning how to build an end-to-end ML product.
Interesting Technical Points
Inference pipeline development journey
The Naive Approach
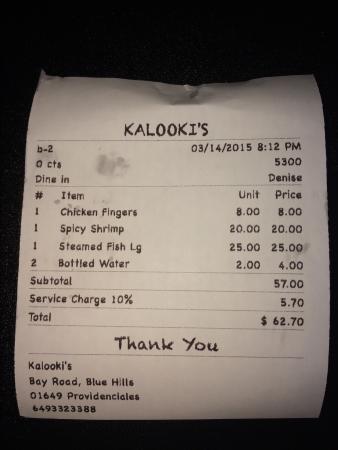
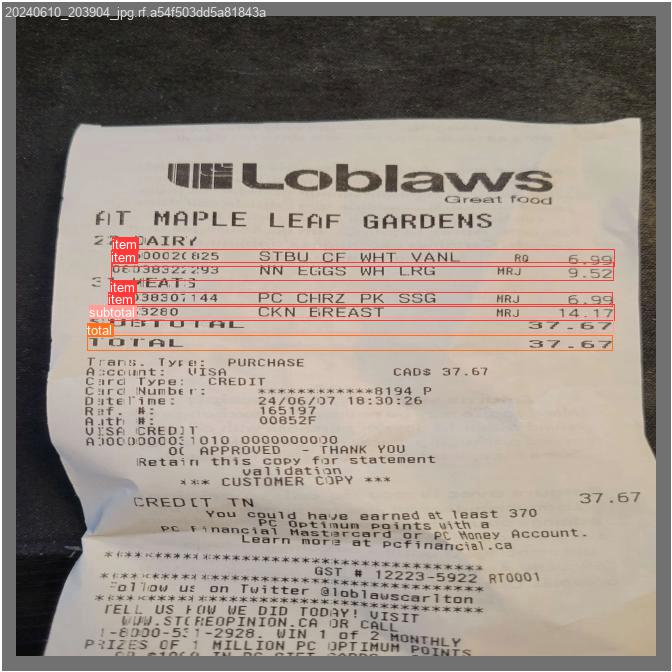
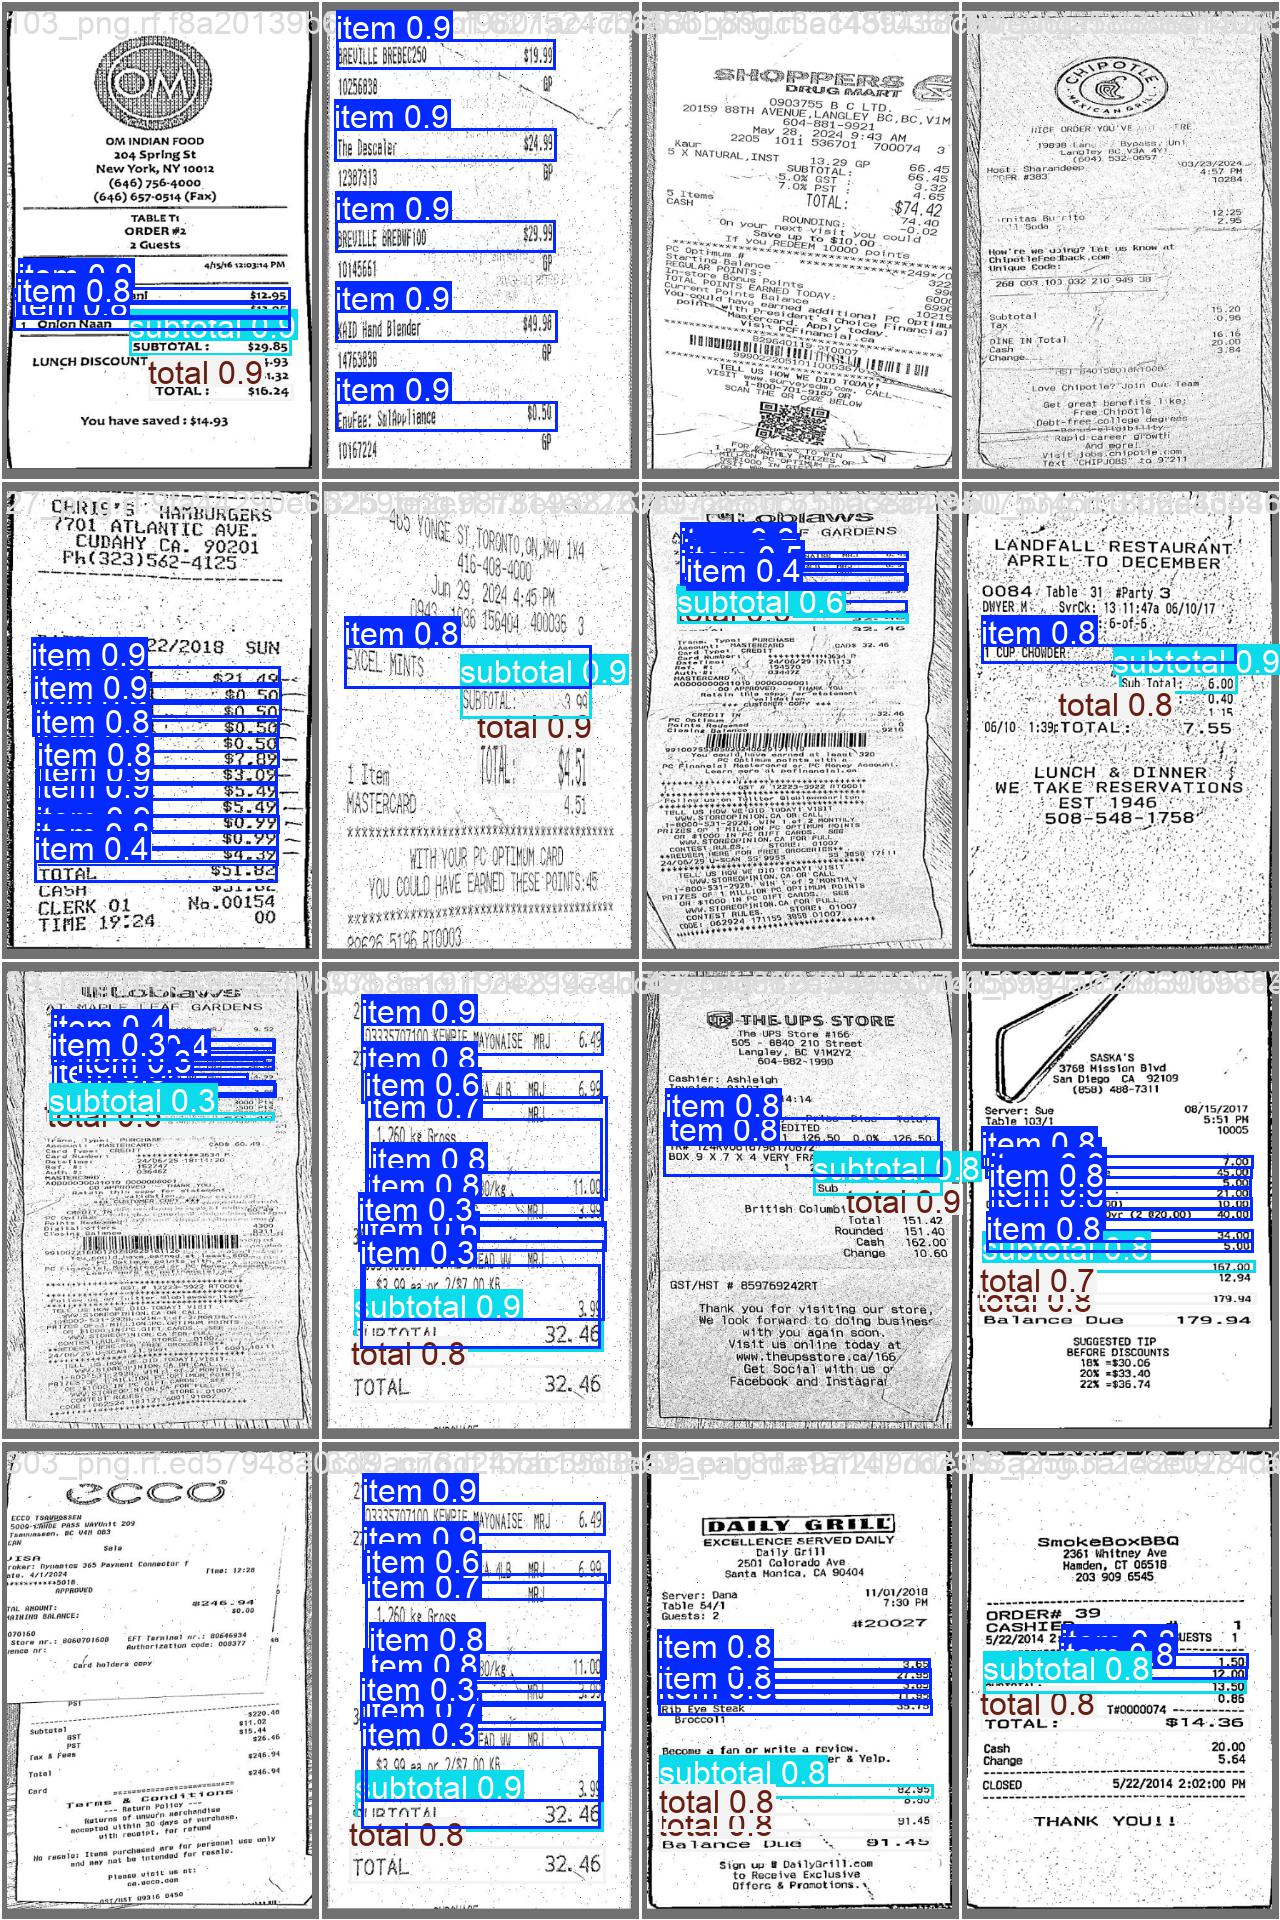
The initial pipeline was straightforward: YOLOv8 for object detection → Custom-trained RCNN for OCR → JSON output. YOLOv8 was trained to detect and bracket three classes of objects on receipts: individual items, subtotals, and totals. Once bounding boxes were established, each cropped region was fed through a custom RCNN model that performed optical character recognition. The RCNN would output text strings, which were then structured into JSON format containing item names, prices, and the receipt total.
The Problem
This approach failed in real-world conditions. Receipts are notoriously difficult to photograph consistently—they fold, crumple, get tilted, and have varying lighting conditions. These physical deformations caused YOLOv8 to struggle with accurate bounding box predictions. A receipt photographed at an angle would confuse the model's spatial understanding. Inconsistent lighting and color variations from different stores' thermal printers further degraded detection accuracy. The model was trained on relatively clean, flat receipt images, and couldn't generalize to the messy reality of actual usage.
Geometric Correction and Greyscale Preprocessing
To address the perspective and lighting issues, I implemented a geometric correction algorithm in fix_angle.py. This became the crucial first step in the pipeline. Here's how it works mathematically:
def wrap_perspective(img, rect):
    (tl, tr, br, bl) = rect  # Top-left, top-right, bottom-right, bottom-left corners

    # Calculate the target width using Euclidean distance
    widthA = np.sqrt(((br[0] - bl[0]) ** 2) + ((br[1] - bl[1]) ** 2))
    widthB = np.sqrt(((tr[0] - tl[0]) ** 2) + ((tr[1] - tl[1]) ** 2))
    maxWidth = max(int(widthA), int(widthB))

    # Calculate the target height
    heightA = np.sqrt(((tr[0] - br[0]) ** 2) + ((tr[1] - br[1]) ** 2))
    heightB = np.sqrt(((tl[0] - bl[0]) ** 2) + ((tl[1] - bl[1]) ** 2))
    maxHeight = max(int(heightA), int(heightB))

    # Define destination points for a perfect rectangle
    dst = np.array([
        [0, 0],
        [maxWidth - 1, 0],
        [maxWidth - 1, maxHeight - 1],
        [0, maxHeight - 1]], dtype="float32")

    # Compute perspective transformation matrix
    M = cv2.getPerspectiveTransform(rect, dst)

    # Apply the warp
    return cv2.warpPerspective(img, M, (maxWidth, maxHeight))
The algorithm works in several stages:
-
Edge Detection: Apply Gaussian blur to reduce noise, then use Canny edge detection to find strong edges in the image. A morphological dilation operation connects nearby edge fragments.
-
Contour Extraction: Use OpenCV's
findContoursto identify closed shapes. Filter contours by area (must be > 1000 pixels) and sort by size to find the largest candidate regions. -
Rectangle Approximation: For each contour, calculate the perimeter and use the Ramer-Douglas-Peucker algorithm (
cv2.approxPolyDP) with an epsilon of 3.2% of the perimeter to simplify the contour into a polygon. A receipt should approximate to exactly 4 points—a quadrilateral. -
Perspective Transformation: Once we have the four corner points of the receipt, we calculate the optimal output dimensions by measuring the Euclidean distances between corners. The perspective transform matrix maps the tilted quadrilateral to a perfect upright rectangle. This matrix satisfies:
where are source coordinates and are destination coordinates in the corrected image.
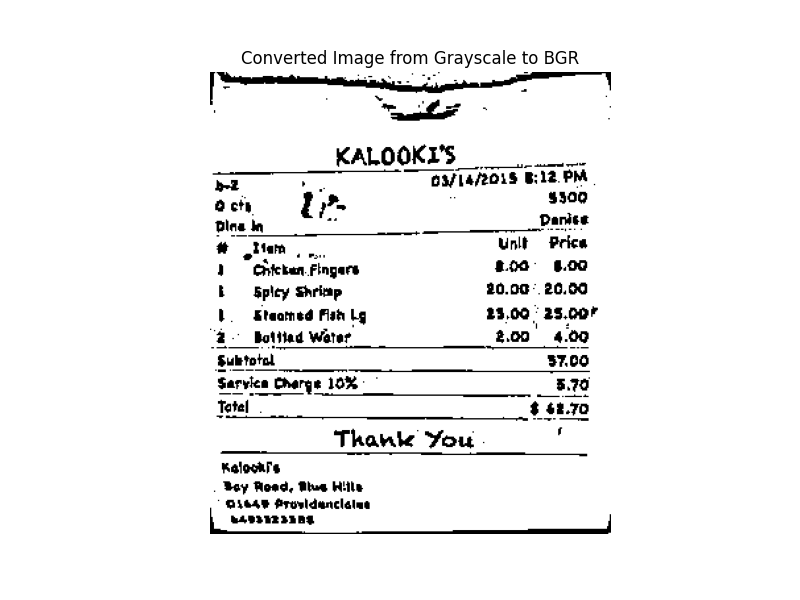
- Greyscale Conversion: After geometric correction, the image is converted to greyscale and then to binary using adaptive thresholding with a Gaussian-weighted sum. This eliminates color variations from different printer types and normalizes the visual information for the downstream models.
def bw_scanner(image):
    gray = cv2.cvtColor(image, cv2.COLOR_BGR2GRAY)
    T = threshold_local(gray, 21, offset=5, method="gaussian")
    return (gray > T).astype("uint8") * 255
Updated Pipeline
Input Image → Geometric Correction (angle fix + perspective warp) → Greyscale + Adaptive Thresholding → YOLOv8 Detection → RCNN OCR → JSON Output
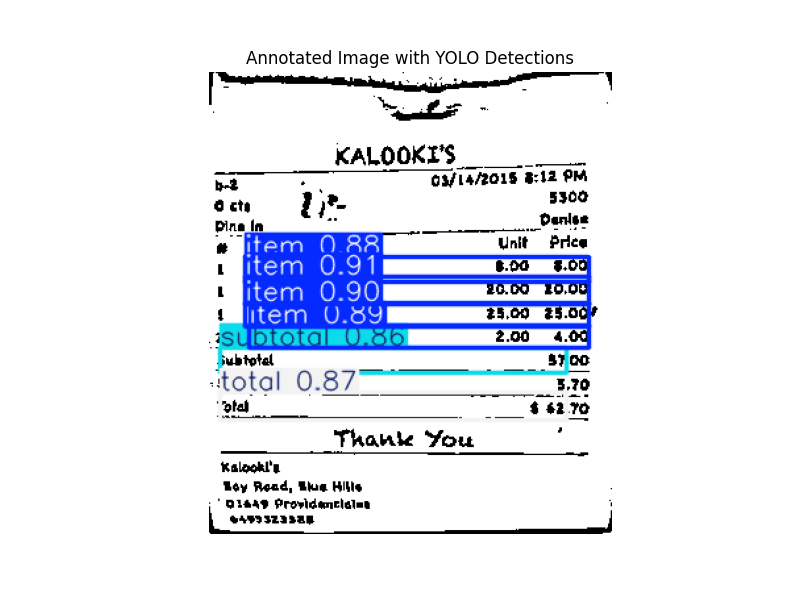
This significantly improved YOLOv8's detection accuracy. The model now received consistently oriented, flat, normalized images regardless of how the user photographed the receipt.
BART-based Error Correction
Even with geometric preprocessing, the RCNN OCR model still made character-level errors. Thermal receipt paper has inconsistent print quality, ink can smudge, and certain character combinations (like "0" vs "O", "1" vs "l") are inherently ambiguous. The OCR might output "M1LK" instead of "MILK" or "APPIE" instead of "APPLE".
To solve this, I fine-tuned a BART (Bidirectional and Auto-Regressive Transformers) model as a sequence-to-sequence error correction system. BART is a denoising autoencoder—it's trained to reconstruct clean text from corrupted input.
BART Training Process
The training data was synthetically generated from a dataset of real product names scraped from Walmart receipts. For each ground-truth product name, I created corrupted versions by:
def misspell(word):
    if len(word) > 1:
        op = random.choice(['rmv', 'rpl'])  # Remove or replace
        pos = random.randint(0, len(word) - 1)
        if op == 'rmv':
            return word[:pos] + word[pos+1:]
        elif op == 'rpl':
            return word[:pos] + random.choice(string.ascii_letters) + word[pos+1:]
- Character deletion: Randomly remove characters from words
- Character replacement: Swap characters with random letters
- Word shuffling: Reorder words in the product name
- Noise injection: Append random character sequences to simulate OCR artifacts
For each product name, 13 corrupted variations were generated, creating a dataset where the input is noisy OCR output and the target is the clean product name. The model was trained for 5 epochs with a learning rate of , using AdamW optimization.
BART Architecture in Action
When the RCNN outputs a string like "WHQLE M1LK 2X GAL", BART tokenizes it, processes it through its encoder-decoder architecture, and outputs the corrected sequence "WHOLE MILK 2% GAL". The model learns contextual patterns—if it sees "M1LK" near "GAL" and "2%", it infers "MILK" based on semantic context.
def runBartPrediction(lst):
    result = []
    for item in lst:
        input_text = " ".join(item)
        tokenized_input = tokenizer(input_text, return_tensors="pt",
                                    padding="max_length", max_length=60,
                                    truncation=True)
        with torch.no_grad():
            predicted_ids = model.generate(
                input_ids=tokenized_input["input_ids"],
                attention_mask=tokenized_input["attention_mask"],
                max_length=60
            )
        predicted_text = tokenizer.decode(predicted_ids[0], skip_special_tokens=True)
        result.append(predicted_text)
    return result
Final Pipeline
Input Image → Geometric Correction & Greyscale → YOLOv8 Bounding Box Detection → RCNN OCR on each bounding box → BART Error Correction → Structured JSON Output
The final output is a JSON object with the following structure:
{
  "0": {"name": "WHOLE MILK 2%", "price": "4.99"},
  "1": {"name": "BREAD WHEAT", "price": "3.49"},
  "2": {"name": "##SUBTOTAL", "price": "8.48"},
  "3": {"name": "##TOTAL", "price": "9.03"}
}
Each receipt item includes its corrected name and extracted price, with special entries for subtotals and totals. This structured data is then consumed by the mobile app to populate the receipt details and calculate spending group totals.
Alternative: GPT-4o Pipeline
For comparison and faster development iteration, I also built a GPT-4o-based pipeline that takes a base64-encoded image and directly returns structured JSON. While this approach is simpler and handles edge cases well due to GPT-4o's strong vision and language understanding, it incurs higher per-request costs and latency. The in-house pipeline remains the primary production system, with GPT-4o serving as a fallback and benchmarking tool.
Cloud Deployment
- Deployed inference on GKE with a mobile client sending images to the server
- Containerized services with Docker and Gunicorn for scalable processing
App Features
Spending Groups
Spending groups are the primary way you organize and view your expenses. A spending group is a collection of receipts (purchases) from a specific date. When you scan receipts, each one gets added to a group for that date. This structure lets you see spending patterns at different levels: zoom out to see total spending by day, zoom in to see which stores you visited, or drill down to individual item details.
How It's Organized
-
Groups: A shopping trip or shopping focus on a specific date. "Grocery run Jan 15", "Weekly errands Jan 20". Each has a date, a name, and a total. This is the container for an entire shopping session. When you ask the app how much did I spend on Jan 10, it's looking at groups.
-
Receipts: Individual stores visited during that shopping trip. On your grocery run on Jan 15, you hit Whole Foods and Target. That's two receipts in one group. Each receipt represents one checkout at one store, with its own store name and total.
-
Items: The actual line items from each receipt. At Whole Foods you bought milk, bread, eggs. At Target you bought shampoo, socks. These come straight from the receipt text recognition.
Intuitive Spending
The organization mirrors how you actually remember your spending. At the highest level, you recall the trip itself: "I went shopping on Jan 15" or "my weekly grocery run." Groups are named after what you did, so you can call it "Costco run" or "Target errands" to make each shopping session meaningful and easy to recall. At the next level down, you remember which stores you visited during that trip. On your grocery run, you hit Whole Foods and Target. That's two separate receipts, two separate store totals. Finally, you can drill into each store to see the individual items you bought. At Whole Foods you grabbed milk, bread, and eggs. At Target you picked up shampoo and socks. This three-level hierarchy matches your natural memory: trip, then stores, then items. You can zoom out to see your total spending for a day, or zoom in to remember exactly what you bought and where.
How the Scanner Fits In
Scanning a receipt does one thing: it creates a receipt in a group for that date. You point the camera at a receipt. The ML pipeline (YOLOv8 to find the text, RCNN to read it, BART to clean it up) pulls out items and prices. That becomes a new receipt. It gets assigned to today's group automatically. Your totals update. Done.
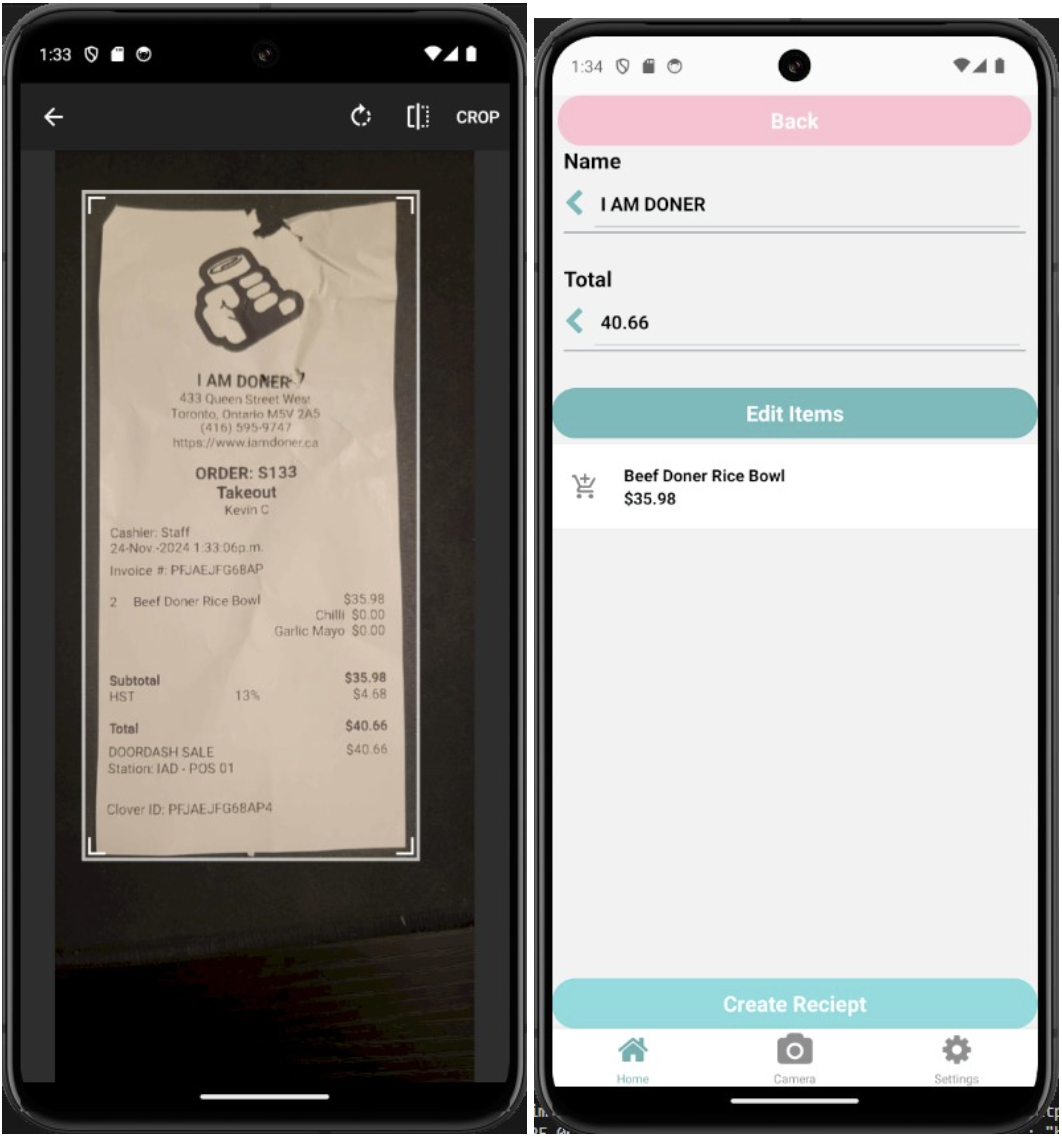
One tap, a second of processing, and your spending is logged and organized. No typing. No remembering. The app does the grunt work, you just point and shoot. That is the whole point. It is fast enough that you actually do it instead of ignoring receipts like everyone else does.
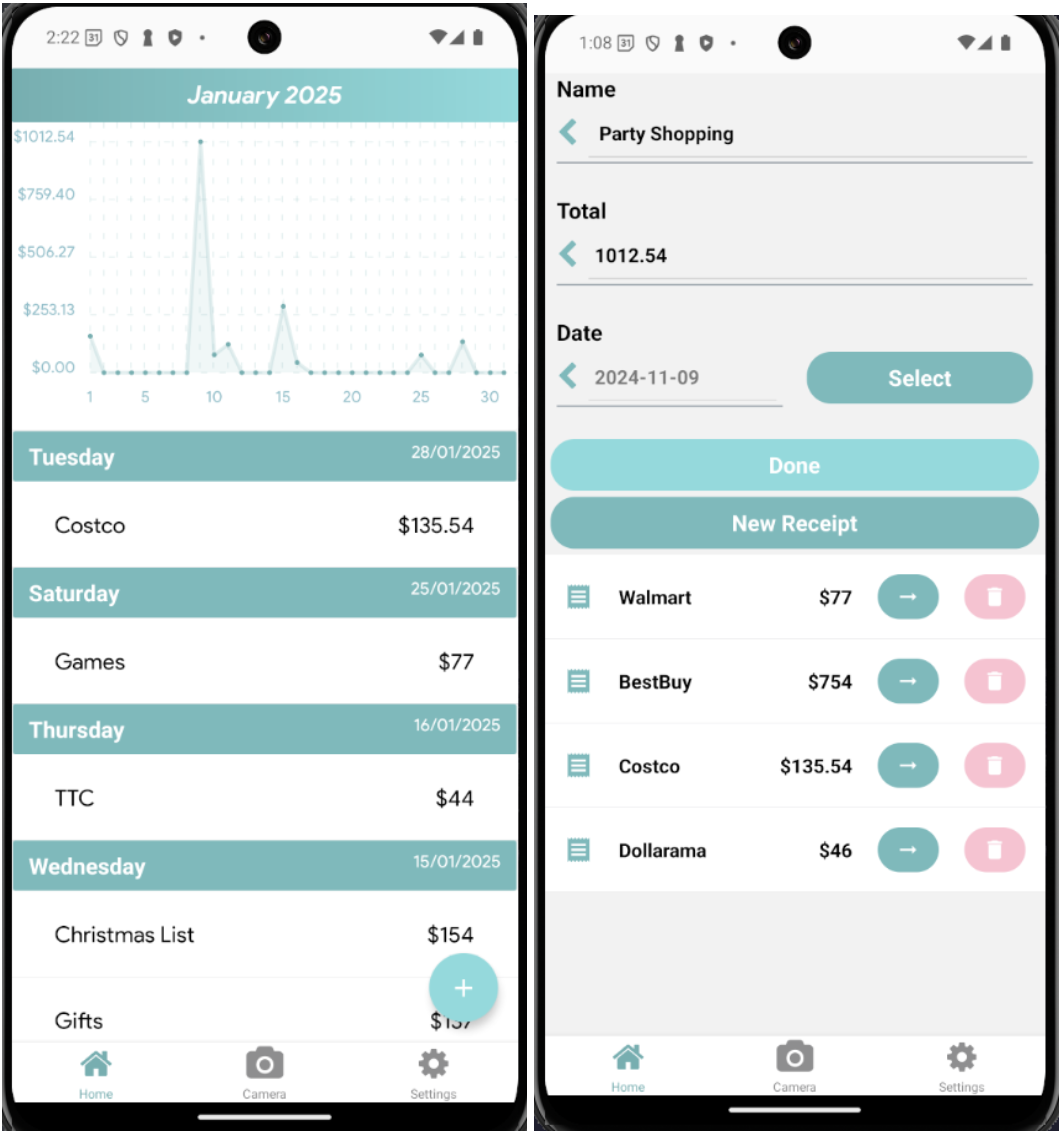
Spending Analytics
Beyond just organizing receipts, the app provides visual analytics to understand your spending patterns. A time-series line graph shows your spending trends across days and weeks, making it easy to spot whether you're on pace with your budget or if certain periods have unusual activity. The graph is grouped by date, so you can see at a glance which days you spent the most and which were quieter. This helps you recognize patterns: maybe you always spend more on Fridays, or you notice certain weeks are consistently higher than others. The analytics aren't just raw numbers either. You can view your spending broken down by store frequency, see which stores you visit most often, and track how much you're spending at each location over time. Combined with the three-level hierarchy of groups, receipts, and items, this gives you both the macro view (am I spending too much?) and the micro view (what am I actually buying?). The data builds up automatically as you scan receipts, so insights emerge naturally without any additional logging or manual tracking.
What I Learned
I learned how data quality and preprocessing drive model accuracy, how to coordinate multiple models in one pipeline, and how to deploy ML services that integrate cleanly with a mobile app.